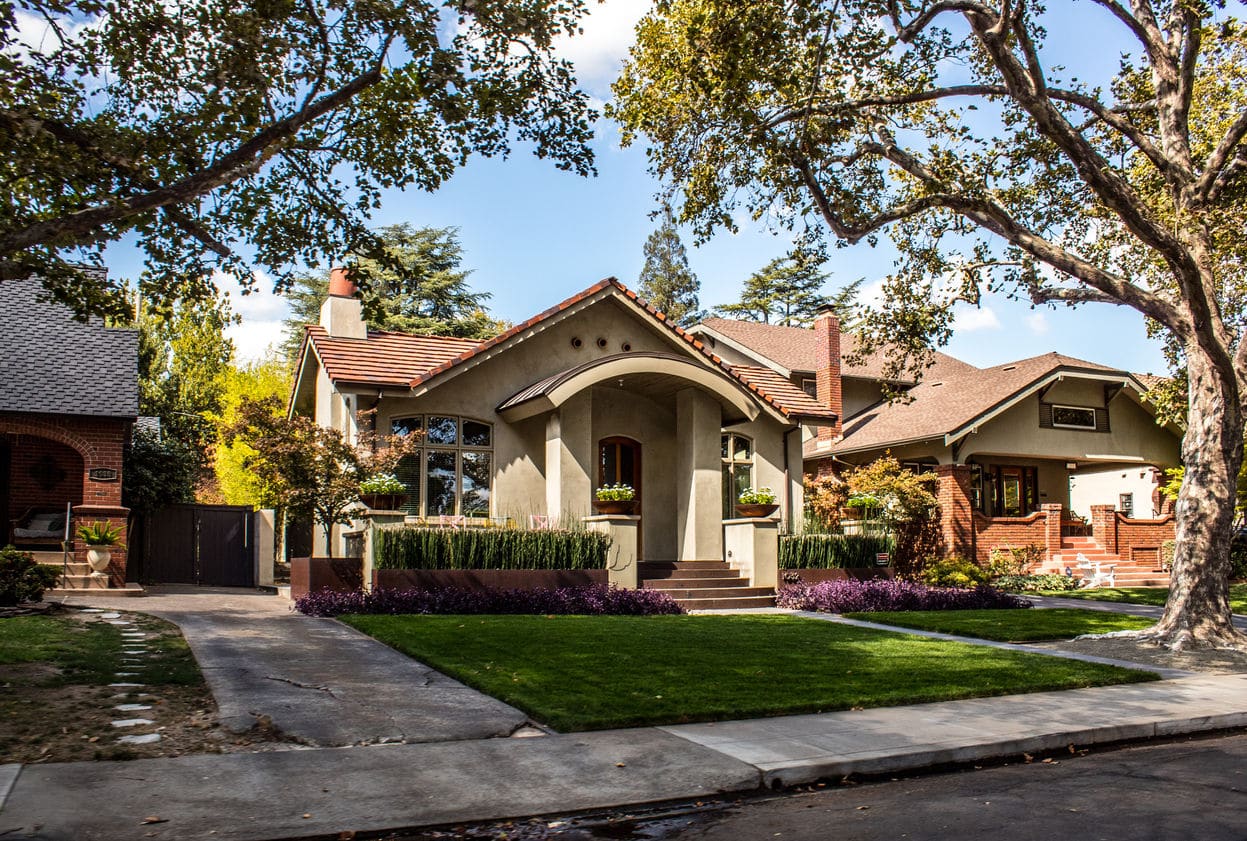
Researching price per square foot for informed buyers
Research Recent Sales in Your Desired Zip Code
Determining the price per square foot by zip code always starts with solid data. Navigating the bustling property landscape, especially in a hyper-digital, fast-moving market like ours, demands some cyberpunk savvy. Whether you’re calculating a sale price or gauging where to buy, looking at recent sales within your specific area is critical for accurate estimates. Let’s plug into the data stream.
Start with actual final sales prices, not just the listing prices. Listings are often inflated to start negotiations with room for reductions, but the final sale price gives you the true market pulse. Got your data jacked in? Now, focus on timeframe. The market can fluctuate faster than a glitch in the matrix, so don’t rely on old numbers. For the most reliable figures, aim to pull data from no more than 30 days ago.
You may also notice that trends often shift, maybe faster than your AI assistant can run analytics. Filter for seasonal variations or sudden economic movements. We all know it’s not just about winter being cold; even sunny zip codes can feel the chill of fluctuating interest rates or surges in local demand.
How to Find the Right Data
Need some tools for the trade? Stealthily infiltrating local real estate listings using platforms like Zillow will give you insights into both the final sales price and the square footage of recent property sales. But don’t stop hacking there. To make sure you’re getting accurate square-footage data, dive deeper. Check with local government websites — tax collectors or property appraiser offices can often provide hidden gems of information, revealing differences between originally reported square footage and the actual space.
If you’re feeling overwhelmed by the data-swarm, fear not. This is where your friendly, digitally-enhanced real estate agent (hello, that’s us at Grand Prix Realty!) works our magic. We can pull property details faster than most open-source bots. Lean on our ability to generate a comprehensive, local price per square foot by zip code rundown. We consolidate sales data, home sizes, even sticky little code upgrades, so you don’t have to.
Accuracy is Everything
In the cutthroat real estate market (whether it’s a wasteland of foreclosures or an undiscovered goldmine), accuracy matters most. If your numbers are off, expect consequences. An inaccurate square footage estimate — whether too low or high — can have sellers listing at the wrong price and buyers paying a premium they didn’t need to. Bottom line: securing precise data now can save you from hardline negotiations later.
Once the numbers add up, the next level is comparing homes. We’re going to dig deeper into that next. You ready? Let’s get into the nitty-gritty of filtering for the best comparable homes in the area.
Identify and Compare Similar Properties for Accurate Data
In the neon-lit world of real estate, where every square foot can mean a difference of thousands in your final price, the key to strategy is comparison – but not just any comparison. To really nail down the price per square foot by zip code, you can’t just look at averages; you need to measure your target property against similar homes to produce rock-solid data. This is how you find the real gems hidden in the digital noise.
Dodge outliers like you would a poorly coded algorithm; these data points can skew your calculations. For instance, imagine a beautifully maintained smart home with a sleek rooftop garden pulling in a hefty price, next door to a fixer-upper with rusting wires and a leaking roof on a fire sale. Can they be compared fairly? No way. Outliers like these drag down your median price per square foot, giving you faulty numbers. Remove what doesn’t compute — homes that don’t fit the usual property traits in your selected zip code.
Instead, what’s needed are **comparable properties** – the ones that share similar features, size, and general condition, even if they have those small custom tweaks. Compare trim details like parking types, outdoor spaces (oh, hello rooftop decks), the quarter-million-dollar kitchen renos, and whether or not they’ve installed solar panels that connect directly into a home’s digital grid. Certain perks and upgrades elevate the home’s value per square foot, but it only works when comparing like-for-like, which means other homes in similar condition, if not functionally built to match.
Focus on Functional Features, Not Just Square Footage
You’ve got your price per square foot averages from within the same zip code, but the price per square foot by zip code can change based on specific features – like a massive garage fitting two Teslas and some hyper-bikes. Does the house you’re eyeing have a state-of-the-art home automation system integrated with AI-driven appliances? Is there a finished basement that can be your VR gaming den? All of these aspects contribute directly to the property’s value, making it crucial to compare the type of living spaces, not just the square footage reported on paper.
The rule of thumb is this: more finished living space equals higher value, but keep your cool. Focus on features that matter in your local market. If you are in a cyber-chic urban sprawl where small-scale space efficiency rules supreme, a slick high-rise condo with no yard could pull in higher square footage rates compared to a sprawling suburban property overflowing with unused grassland.
The Power of Grouping Similar Properties
One of the best ways to fine-tune your calculations involves categorizing homes by their unique but comparable attributes. Start sorting — by new builds, modern renovations, or even older homes with slight upgrades in key areas like kitchens or baths. Proximity to key amenities or tech infrastructure, like electric car charging stations, can also nudge prices upward.
Your virtual strategies don’t stop there. Factor in unique features that tend to resonate with today’s buyers. A house with a gym pods-over-hardwood-floor combo brings more weight in areas saturated with local Silicon Valley nomads over fifty-year-old Americana suburbs.
Let’s plug into the digital ether and lay out the homes you’ve been eyeing. Do they all paint the same futuristic story, or are there odd, out-of-place relics reducing your data to default-mode? Only after your comparables are clean can you start your proper analysis. This process helps to create not just an informed home price, but a hyper-accurate reflection of that price per square foot by zip code that buyers (and sellers) will absolutely pay for. Trust me, this set of codes is essential in your home shopping simulation.
Let’s Get Hacked In: Calculating Your Average Price per Square Foot
So what do you do after filtering out all those misfits? With the remaining properties —and here’s where it gets sweet, you’re going to average their prices out like a talented coder pulling bits of useful data to decipher the bigger picture.
You’ve eliminated the rusty relics and outdated programming; now calculate the price per square foot of each home by dividing the sale price by the property’s square footage. Then, sum all your valid property price-per-square-foot numbers and divide by the total number of homes.
Still sound like too much processing power? No worries, your Grand Prix Realty realtor has the necessary tools to streamline those calculations like we’re running endless loops in pocket AI. Once you get that magic number — the average price per square foot by zip code — you’ll have the ultimate data-driven number to plug into your home purchase or sale.
Analyze Factors Affecting Price Per Square Foot
Understanding the price per square foot by zip code can’t just be about raw numbers. Various factors come into play that mold this figure. These elements transform cold numerical data into a living, breathing calculation that mirrors the reality of market conditions. Whether you’re jacking into the code from a buyer’s or seller’s perspective, this next level of analysis will give you stronger insights and help shape more informed decisions. Let’s get our hands on some of those more subtle script variables.
It’s All About Location, Baby
In real estate, location trumps everything. You know the drill: the same house just a few blocks apart can vary dramatically in price per square foot. That’s why when calculating the price per square foot by zip code, keeping the area nuance in mind is essential.
Neighborhood desirability can spike prices like they’re on a roller coaster. Are we talking about a trendy urban hub with rooftop roller discos, or a sleepy suburb with rows upon rows of identical white picket fences? Proximity to vibrant areas like downtown, access to public transportation, or even closeness to high-ranking schools can add serious weight to the value per square foot.
Don’t overlook micro factors like proximity to noisy highways or railroads, which can zap property desirability. A quiet street might pump up that price per square foot—but you’ve gotta balance it against other features. Zip codes can be strange animals, mixing charm with challenges. Don’t let wide geo-assumptions skew your equation.
Condition and Age: The Real Wear and Tear
A home’s condition goes beyond shiny cyberpunk décor or sleek exterior panels. It’s deeply tied to everything that isn’t visible through the digital ether. Buildings flaunting newer technology, smart-home installations, or fewer repair needs can hike the price per square foot.
On the flip side, if a home’s hardware is running on old, outdated circuits—think legacy electrical systems, weathered roofs, or plumbing that belongs more in a museum than a modern home—expect that square footage price to drop faster than an out-of-favor bot on the blockchain.
Still, age doesn’t always equate with depreciation. Charmingly maintained older homes in historical districts can also pull in serious dough per square foot. It’s the smart upgrades that keep properties ahead of the curve: from modern insulation to solar energy grids, homes that flex efficient and eco-friendly features dominate the pricing game.
Community and Amenities: Enhancing the Experience
Now let’s crack the code on amenities, as these can be a major perk or a dealbreaker. Buyers are increasingly looking for homes that reflect their lifestyles, and where basic square footage isn’t enough. In-demand features can pump up the price per square foot in any zip code you target.
Consider the pull of futuristic amenities: from climate-controlled Tesla garages to finished basements doubling as VR rooms. Does the house offer smart systems, integrated LED or mood lighting? You better believe these are part of the equation. Fancy pools, sleek patios, digital lock systems with bio-authentication—these features increase the property’s desirability, significantly affecting the price per square foot.
Watch the Market Trends
Here’s where a bit of coding finesse comes in handy (and maybe a well-timed sip of neo-caffeine): market patterns play a pivotal role in determining current rates. Overall property values fluctuate with interest rates, economic shifts, and supply-demand dynamics—all factors that alter price per square foot. To break it down, that sudden rise in property values in a desirable area? Could just be a temporary blip caused by low interest rates, or a sudden influx of new buyers.
A hot seller’s market will see rising price per square foot rates as inventory dwindles. Meanwhile, in a buyer’s market? Expect more flexibility on square footage costs across the board. But here’s the trick: as quick as the market changes, so does the price per square foot by zip code. Staying flexible and nimble in your research (or having a good realtor with their eye on real-time data) will keep you from being undercut or price-hyped by volatile figures.
Digital Tools and AI Resources
Gone are the days when a simple calculator was enough to estimate the price per square foot. In today’s cyberpunk housing markets, with trends shifting overnight, real-time tools can significantly influence your decision-making process. Platforms like Zillow offer rapid access to multiple data sets, but if you really want to dig deep into the heart of your targeted zip code, your best bet is an AI-driven analytics platform. Leveraging data sets from local property databases and real-time sale feeds will generate accurate insights in a fraction of the time manually splitting your calculations.
No matter whether you’re using a cutting-edge tool or pulling listing history from last month’s sales data, one thing is clear: harnessing the right resources and methodologies is key to decoding the accurate price per square foot by zip code.
Let’s keep this code rolling. You’re now equipped with the building blocks to truly analyze your property data and cut through that noisy digital chatter. But wait, there’s more—next up we dive deeper into tracking comparative sales through the ultimate local home analysis algorithms. Ready to plunge deeper into the binary?


